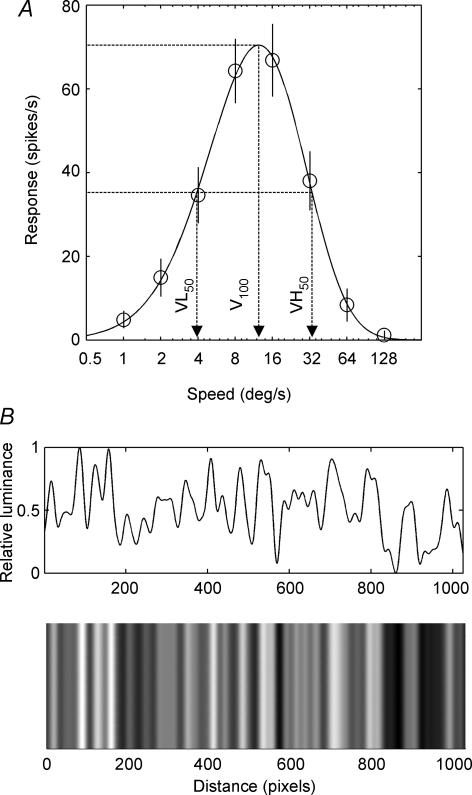
Figure 1. Response of an area-17 neuron to aperiodic gratings moving at different speeds.
A, an example speed tuning response function from an area-17 neuron. Mean spiking responses (ordinate) to various test speeds (abscissa) were fitted to a skewed Gaussian function (continuous line; see Methods). The arrows show the peak of the function and the two semisaturation points. For each cell, these three speeds were used as the adapting speeds: the preferred speed (V100); the slower speed that elicited 50% of the non-adapted max response (VL50); and the faster speed that elicited 50% of the non-adapted max response (VH50). Error-bars are ± 1 s.e.m. B, a schematic diagram of the aperiodic grating used in the experiment with the luminance waveform shown above the example stimulus.

