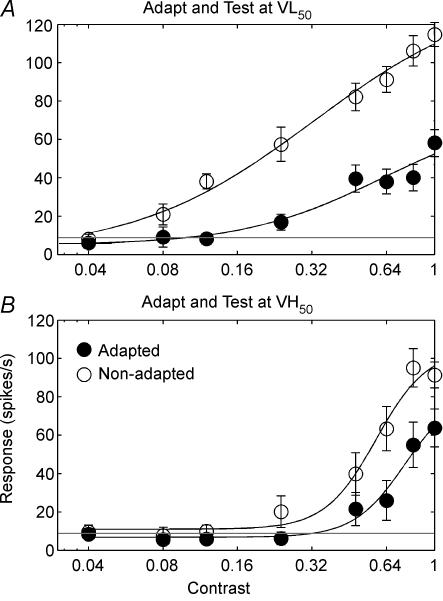
Figure 4. Changes in the contrast response functions of an example cell following adaptation to VL50 (A) and VH50 (B).
For both graphs contrast (abscissa) is plotted against spikes per second (ordinate). Open circles represent the non-adapted case while the filled circles represent the adapted case. Continuous lines show the best fit to a sigmoid (see Methods). Dashed horizontal lines represent the spontaneous firing rate. Response gain can be seen as a reduction of the maximum firing rate while contrast gain is a shift in the contrast response function along the log-contrast axis toward higher contrasts.

