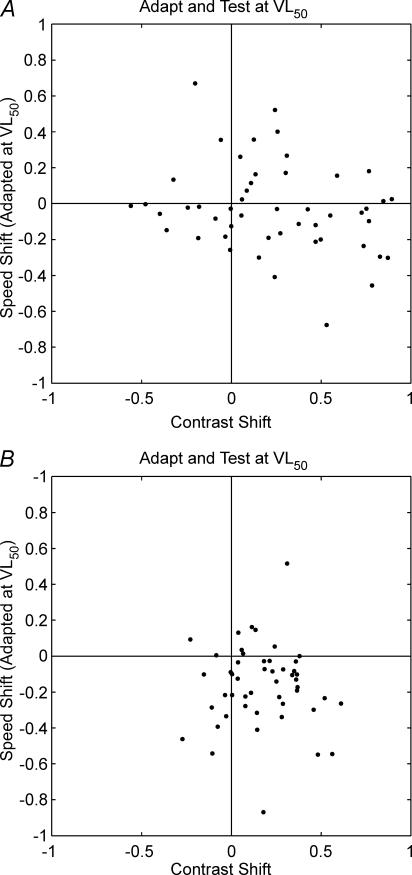
Figure 5. Relationship between contrast gain control and shifts in preferred speed following adaptation.
Scatter plots showing speed-shift (ordinate) as a function of contrast-shift (abscissa) following low (A) and high (B) speed adaptation for each cell. Points to the right of the vertical line indicate an increase in C50 following adaptation (contrast gain control). Points below the horizontal line indicate a reduction in the peak speed of the cell following adaptation.

