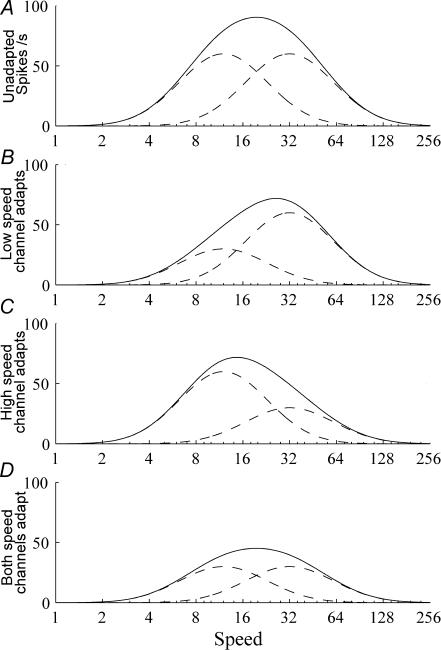
Figure 7. Two-channel model of speed adaptation.
A shows the speed tuning of a hypothetical cell (continuous line) created by adding the inputs of two separately speed tuned inputs (dashed lines). Adapting the low speed input will reduce its response and skew the tuning curve away from it toward higher speeds (B). Adaptation that reduces the high speed input skews the tuning curve to lower speeds (C). Adaptation at the peak speed reduces both inputs equally, and decreases the amplitude of the tuning curve without changing the location of its peak (D).

