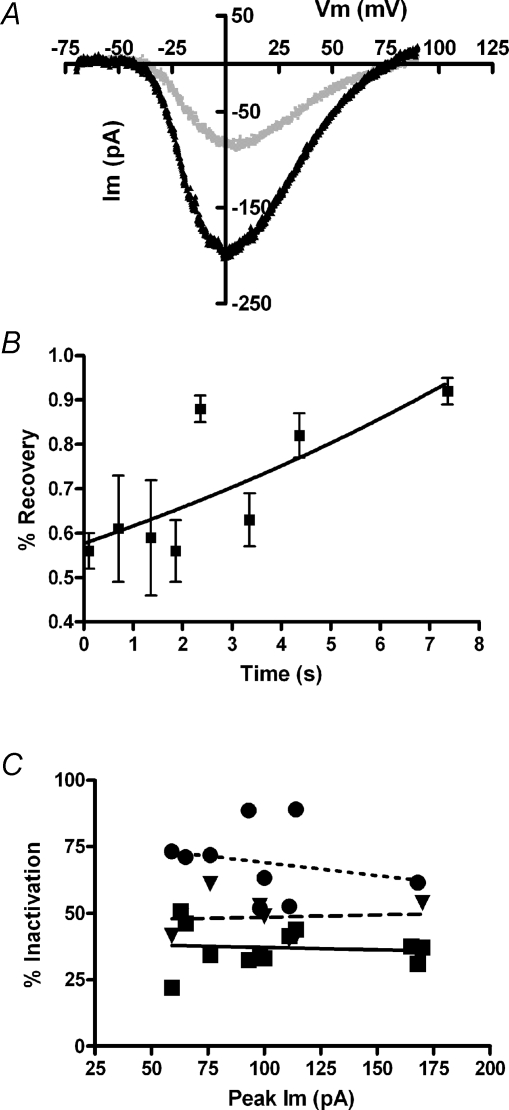
Figure 2.
Characterization of inactivation A, current produced in 20 mm external calcium (1.0 mm EGTA internal buffering) during 100 mV/100 ms voltage ramp 100 ms before, and 100 ms after, a 2 s depolarization to 0 mV that produced 60% inactivation (holding voltage −70 mV). Each I–V relation was corrected for the linear leak calculated between −70 and −60 mV. After leak correction the reversal potential was +74 mV before and +82 mV after inactivation. B, recovery from inactivation (peak current as percentage of control, from voltage ramps as in A, measured at successive times after a 2 s inactivating step to 0 mV (20 mm external calcium, 1.0 mm EGTA internal buffering). Calculated doubling time (single exponential fit) was 10.5 s with r2 only 0.59; 95% confidence interval from 5.9 to 47.9 s. C, percentage inactivation (during 2 s depolarization) as a function of peak calcium current in each cell (20 mm external calcium). Different concentrations of EGTA are indicated by the symbols (•= 0.1 mm,▾= 1.0 mm, ▪= 10 mm). Linear fits through each buffer condition have slopes not statistically different from zero. The relation between buffer concentration and percentage inactivation is shown in detail in Fig. 5.

