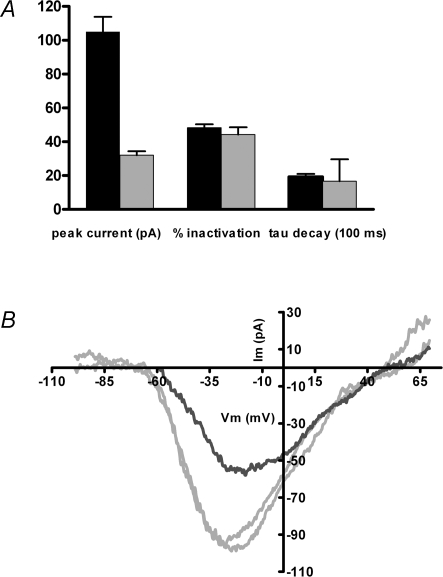
Figure 6.
Inactivation in ‘physiological’ external calcium A, inward currents were measured in 13 cells exposed successively to 2 and 20 mm external calcium (1.0 mm EGTA internal buffer). Peak inward currents and percentage inactivation were determined from voltage ramps executed before and after a 2 s depolarization to the peak of the I–V relation from −70 mV holding voltage. The time constant of inactivation was taken from a single exponential fit to the current during the inactivating step. Only peak currents were significantly different (105 ± 8.8 pA, mean ±s.e.m., n = 13 in 20 mm calcium; 32 ± 2.4 pA, in 2 mm calcium, n = 13). The percentage inactivation in 20 mm calcium (48 ± 2.1%, mean ±s.e.m.) and in 2 mm calcium (44 ± 4.3%) was not different (nor did it differ from the independent measurements averaged in Fig. 5, 48 ± 2.2%), nor was the time constant of decay significantly different (1.9 ± 0.2 and 1.7 ± 0.3 s, mean ±s.e.m., in 20 and 2 mm calcium, respectively). B, voltage ramps evoked inward currents in 2 mm external calcium from a holding potential of −90 mV (grey traces) before and after an I–V collected at −50 mV holding potential (black trace). In 7 such experiments, the ratio of peak inward currents obtained at −50 mV to those from −90 mV was 0.50 ± 0.20 (mean ±s.e.m.). The average recovery value (comparing the I–V peak from −90 mV before and 1 min after inactivation) was 0.82 ± 0.08.

