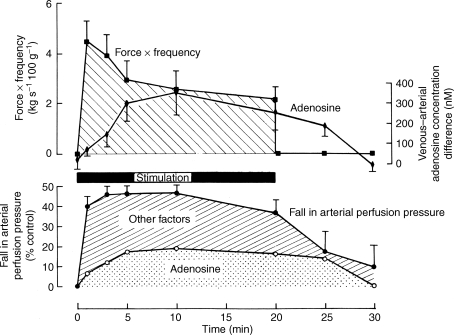
Figure 1.
Comparison between time course of the venous-arterial differences in plasma adenosine concentration and the force frequency of contractions (above) and the change in arterial perfusion pressure (below), during and after contractions of the constant-flow perfused gracilis muscle for 20 min In the graph below, the proportion of the total vasodilatation that could be attributed to the released adenosine, is shown by the stippled area. All recorded data are shown as mean ±s.e.m. Reproduced from Ballard et al. (1987) with permission from Blackwell Publishing Ltd.

