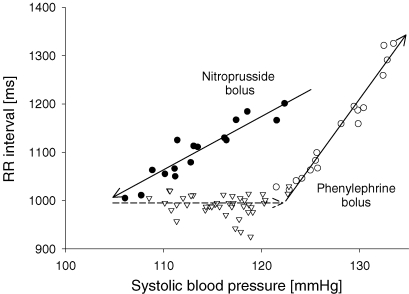
Figure 1.
Typical baroreflex hysteresis pattern observed after sequential bolus injections of nitroprusside and phenylephrine Filled circles and continuous arrow pointing downwards represent the linear relation in the pressure–RR interval relationship for pressure fall. Open triangles and dashed arrow represent baroreflex resetting between pressure fall and rise. Open circles and continuous arrow pointing upwards represent the linear relation in the pressure–RR interval relationship for pressure rise.

