Figure 1.
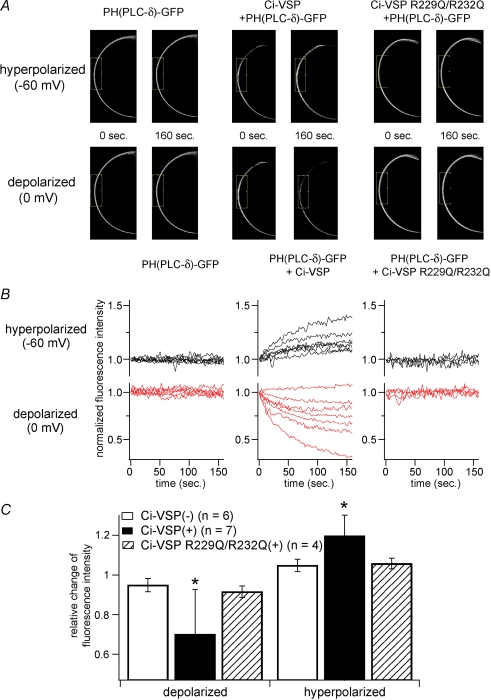
Confocal imaging with PtdIns(4,5)P2 sensitive PHPLC–GFP reports that PtdIns(4,5)P2 is decreased by Ci-VSP during membrane depolarization A, confocal images of oocytes under conditions of hyperpolarized (−60 mV) or depolarized (0 mV) membrane potential. GFP-fused PH domain of PLC-δ (PHPLC–GFP) was coexpressed with (middle panels) or without (left panels) Ci-VSP in Xenopus oocytes. Images just before changing membrane potential (0 s) and at the last timing of the step (160 s) are indicated as pairs. PHPLC–GFP coexpressed with Ci-VSP concentrated to and diffused from plasma membrane in the hyperpolarized (upper panel) and depolarized (lower panel) condition, respectively. When cell was inserted with two microelectrodes, it usually showed resting membrane potential ranging from −30 mV to −10 mV. Then the recording mode was switched to voltage clamp mode with holding potential of −60 mV for 160 seconds, stepped to 0 mV for 160 seconds, finally to −60 mV again for 160 seconds. Signals during the first hyperpolarizing stimulus are shown. Cells expressing PHPLC–GFP with voltage-insensitive Ci-VSP mutant (R229Q/R232Q) did not exhibit such translocation (right panel). B, temporal change of fluorescence intensity of GFP under voltage clamp. The intensity was standardized by the initial intensity. Individual traces were obtained from different cells. In the cells shown in A, intensities in the boxed regions were measured. C, averaged change of fluorescence intensity from multiple cells. Minimal (depolarized) or maximal (hyperpolarized) intensity during each recording was corrected by the intensity at time zero in individual cell. Asterisks indicate a statistically significant difference (P < 0.05) from Ci-VSP(–) cells.

