Figure 8.
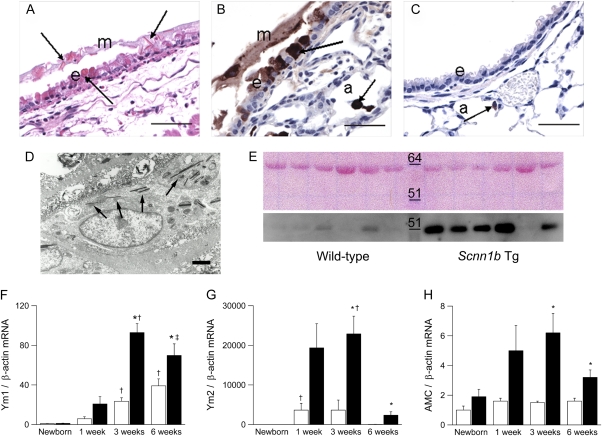
Pulmonary expression of chitinases in β-epithelial Na+ channel (βENaC)-overexpressing mice. (A) Eosinophilic crystals in airway epithelium and overlying mucus and intracytoplasmatic material in nonciliated epithelial cells (arrows) in a large-diameter main axial airway from a βENaC-overexpressing mouse (hematoxylin and eosin). e = Epithelium; m = mucus, scale bar, 50 μm. (B, C) Immunolocalization with polyclonal antibody for Ym1 showing strong Ym1 staining in airway mucus, nonciliated epithelial cells, and alveolar macrophages (arrows) of βENaC-overexpressing mice (B). a = Alveoli. (C) In wild-type mice, weak Ym1-positive staining was limited to alveolar macrophages (arrow). Scale bars, 25 μm. (D) Transmission electron microscopy of a macrophage in the airway lumen from a βENaC-overexpressing mouse containing intracellular electron-dense crystals (arrows). Scale bar, 2.5 μm. (E) Western blot for AMCase in bronchoalveolar lavage from wild-type and βENaC-overexpressing mice. Upper panel: Membrane stained with Ponceau S to control for equivalent loading (∼60 kD band likely represents albumin). Lower panel: AMCase (molecular weight ∼52 kD) is more abundant in bronchoalveolar lavage fluid from βENaC-overexpressing mice than in wild-type littermates. Representative for n = 6–8 mice per group. (F–H) Expression levels of Ym1, Ym2, and AMCase transcripts in lungs from wild-type (open bars) and βENaC-overexpressing (solid bars) mice at birth, 1 week, 3 weeks, and 6 weeks of age. Data are expressed as fold changes from newborn wild-type mice. n = 6–14 mice per group. (F) Ym1 mRNA. *P < 0.05 versus wild-type mice of same age; †P < 0.05 versus newborn and 1-week-old mice of same genotype; ‡P < 0.05 versus newborn βENaC-overexpressing mice. (G) Ym2 mRNA. *P < 0.001 versus wild-type mice of same age; †P < 0.05 versus newborn and 6-week-old mice of same genotype. (H) AMCase mRNA. *P < 0.01 versus wild-type mice of same age.

