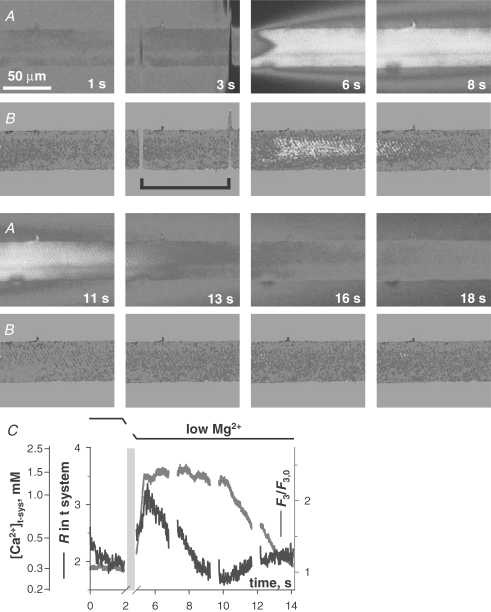
Figure 4.
SOCE during Ca2+ release and removal A, selected images of fluorescence F3 of cytosolic rhod-2 and B, ratio R of fluorescence images F1 and F2 of mag-indo-1 in the t system, simultaneously acquired while applying the release-inducing low Mg2+ solution. C, spatially averaged values of F3 (normalized by resting value F3,0, red) and R (blue) versus elapsed time (which maps to the abscissa of x–y scans as described in Methods). The interval of solution change is indicated by the black bracket in image B at 3 s, and by the light blue bar in C, where fluorescence and ratio plots were omitted during solution change. (ID: 072005b_s013.)

