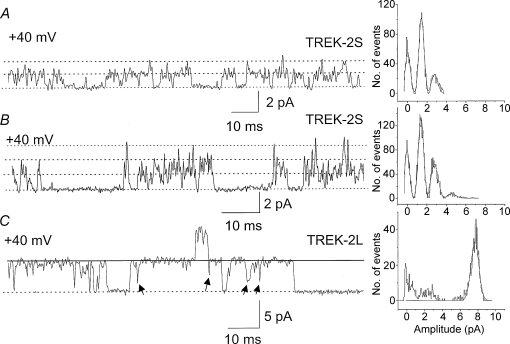
Figure 4.
Different conductance levels of TREK-2S, and sub-conductance levels of TREK-2L Cell membrane potential was held at +40 mV. A, this cell-attached patch contained the TREK-2S phenotype in which only two open levels were present, as indicated by dotted lines. Amplitude histogram is shown on the right. B, this patch contained the TREK-2S phenotype in which three open levels can be identified. C, a patch containing TREK-2L is shown. Arrows indicate the short-lived sub-conductance levels. Amplitude histogram showing the main peak is also shown

