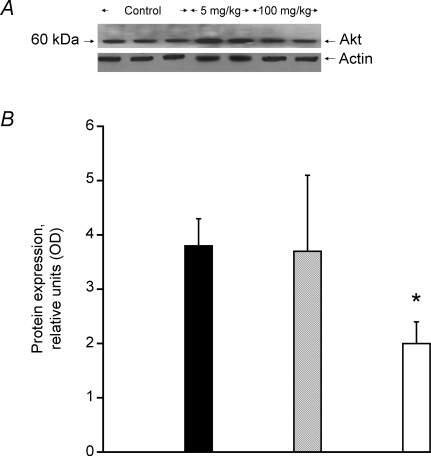
Figure 5.
Akt1 protein expression in skeletal muscle A, a representative Western blot of Akt1 protein detected at 60 kDa. B, the average density of Akt1 protein bands, measured by Western blot in soleus muscle lysates obtained from rats fed with either vehicle (hydroxypropylmethylcellulose) (filled columns) or GW610742 at 5 mg (kg bm)−1 (cross-hatched columns) and 100 mg (kg bm)−1 (open columns). *Significantly different from the corresponding control (vehicle) group (P < 0.05).

