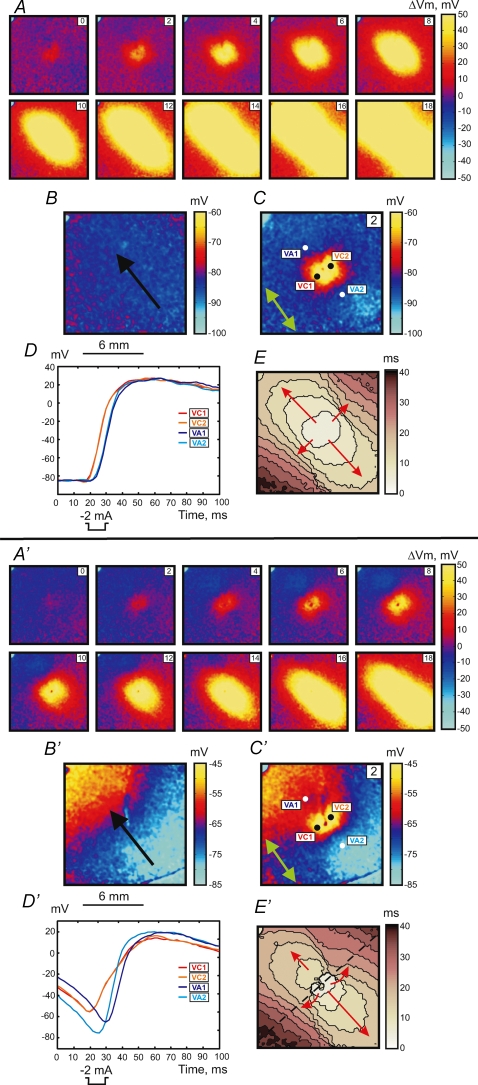
Figure 1.
Upper panel (A–E), make response to S2 stimulus of 2 mA in amplitude and 10 ms in duration at a coupling interval of 300 ms for S1 propagation along the fibre direction S1 planar wave propagation is from the lower right to upper left. A, images of ΔVm distribution as a function of time. The numbers in the upper right represent the time in ms since the onset of S2 point stimulation at the centre of the image. The size of the image is 12 mm × 12 mm. B, Vm distribution during S1 repolarization corresponding to the timing of the Vm image during S2 in C. The black arrow shows the direction of S1 planar wave propagation. C, image of Vm distribution 2 ms after the beginning of S2. The green arrow shows the fibre direction (FD). D, four representative traces recorded in the VC (red) and VA (blue) areas. The pixel locations for these traces are indicated with white and black dots in C. E, activation map. The scale shows elapsed time since S2 onset; isochrones are drawn every 4 ms. Lower panel (A′–E′), intermediate make–break response to the stimulus at an S1–S2 coupling interval of 195 ms. S2 has the same parameters as in the upper panel. A′, images of ΔVm distribution as a function of time. B′, image of Vm distribution during S1 repolarization. C′, image of Vm distribution 2 ms after the beginning of S2. D′, four representative traces recorded in the VC (red) and VA (blue) areas. E′, activation map with 4 ms isochrones. The blue spot in the upper left corner is an artifact from an LED used to indicate stimulus timing.

