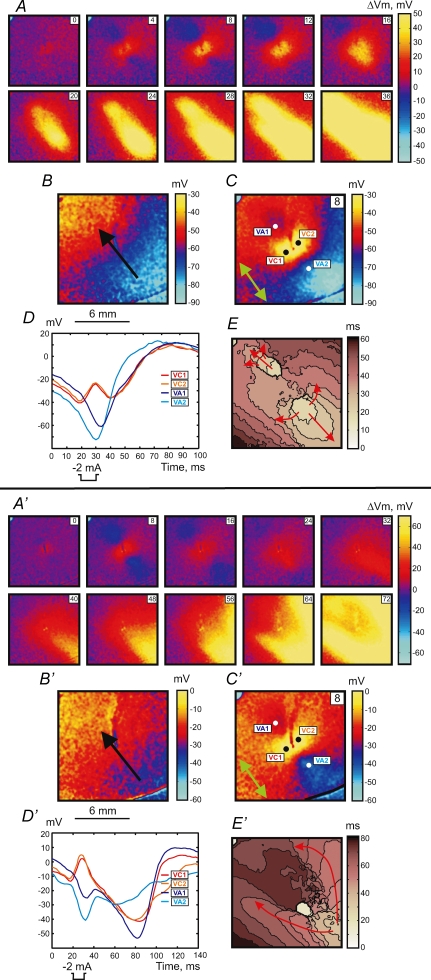
Figure 2.
Upper panel (A–E), break response to S2 stimulation at a coupling interval of 188 ms for S1 propagation along the fibre direction The S2 amplitude and duration are the same as in Fig. 1. Lower panel (A′–E′), DW mediated response to the stimulus at an S1–S2 coupling interval of 158 ms. The isochrones (E and E′) are drawn every 5 ms. For a detailed description see the legend to Fig. 1.

