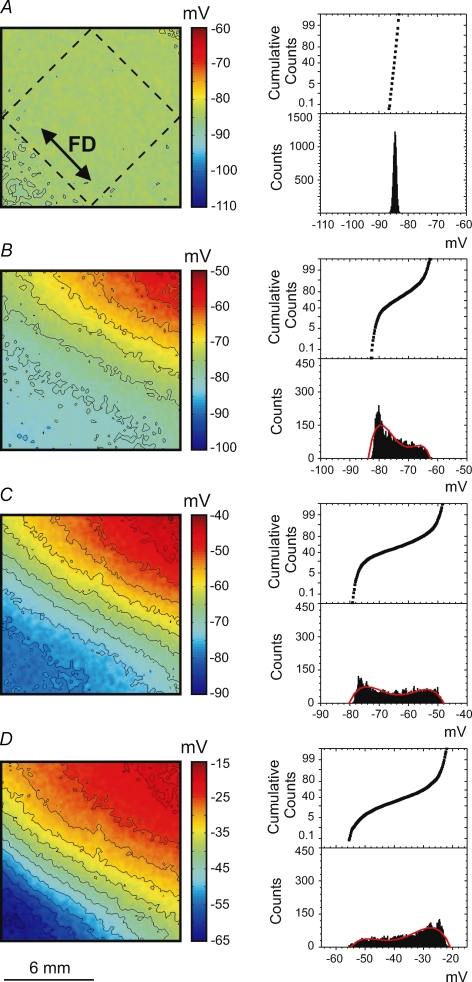
Figure 8.
The images of Vm distribution (left column) and the Vm histograms (right column) caused by the S1 wave at the time point corresponding to the end of the S2 pulse related to four different stimulation mechanisms when the S1 planar wave propagates transverse to the fibre direction A, make stimulation; B, intermediate make–break stimulation; C, break stimulation; D, DW mediated stimulation. For a detailed description, refer to the legend to Fig. 4.

