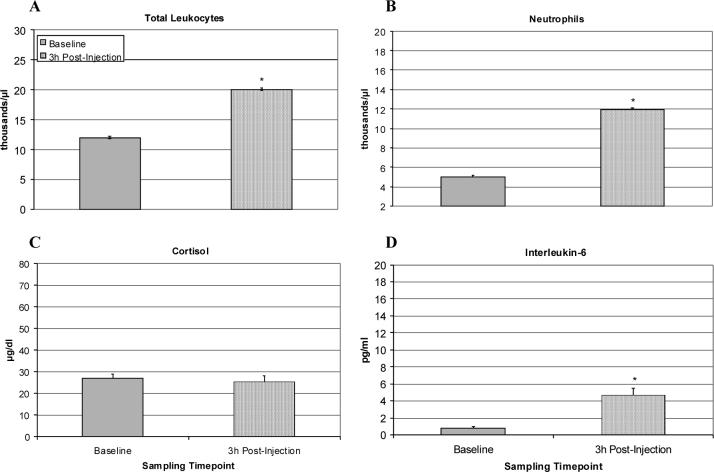
Figure 5.
Physiological effects of saline or LPS in the home cage at 3 h post-injection (n = 10). Data are expressed as Mean ± SEM. (A) Total leukocyte number per μl. (B) Number of neutrophils per μl. (C) Plasma cortisol (μg/dl). (D) Plasma IL-6 levels (pg/ml). There was a significant shift in the cell differential due to LPS, but the resulting neutrophilia and IL-6 changes were more modest than in Experiment 1. Cortisol levels were not elevated above baseline. *p<.05.

