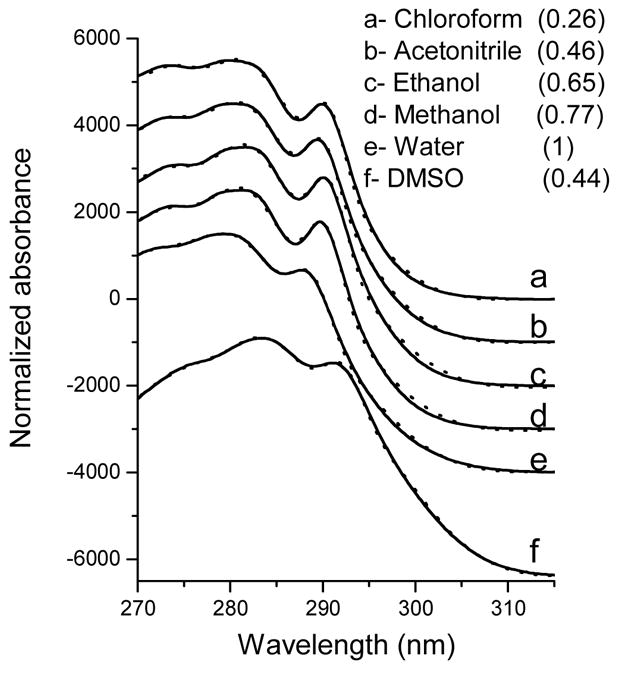
Figure 3.

Absorption spectra (solid curves) of NATA in various solvents. The spectra have been shifted vertically to reduce overlap. The dotted lines are generated by fitting of the experimental data to the sum of the 1La and 1Lb, spectral (see “Methods” for details) components of which are shown in Figure 4. The numbers in parentheses represent the values of corresponding solvents, which were taken from the reference [31].
