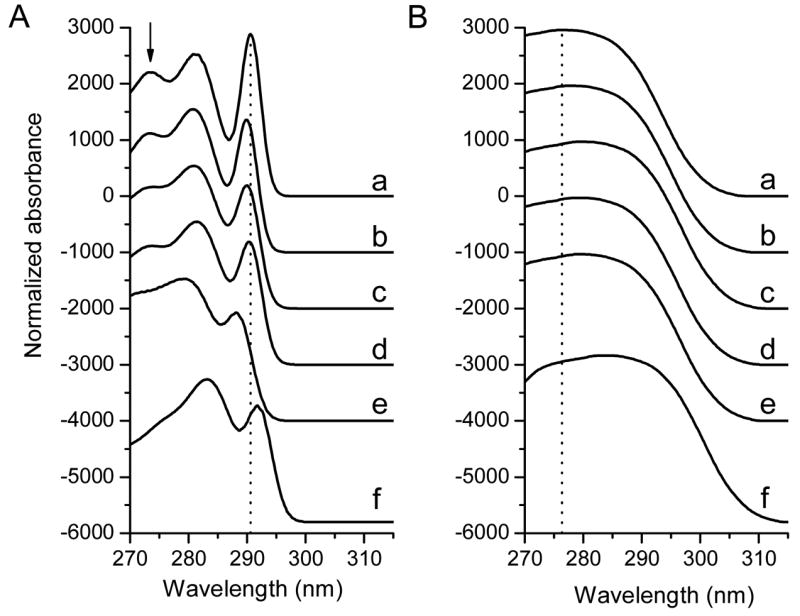
Figure 4.

The resolution of absorption spectra of NATA in various solvents into the 1Lb (A) and 1La (B) components. Each set of the 1La+1Lb spectra is the best fit for the absorption spectrum corresponding to the particular solvent (Fig. 3). The spectra have been shifted vertically to reduce overlap. To better follow the solvent-related spectral shift, the dotted vertical lines are located at the 0-0 transition of 1Lb (A) and the maximum of the 1La bands (B) of NATA in chloroform. The arrow in (A) shows the position of the 0+2×850 transition. The small letters refer to the various solvents (same as in Figure 3).
