
Figure 5.
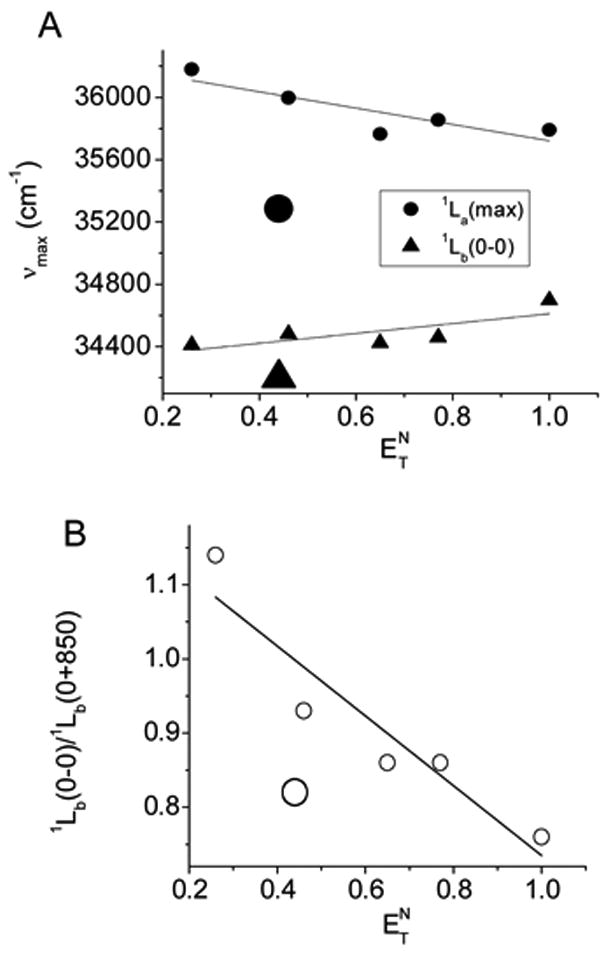
Linear correlations between solvent polarity values and the spectral parameters ((A) maxima of the 1La and the 0-0 transition of 1Lb; (B) ratio of the amplitudes of the 0-0 and 0+850 transitions) for the absorption spectra of NATA. The positions of the 0-0 transitions of the 1Lb in various solvents were determined from the 2nd derivative of the corresponding absorption bands. The larger symbols, which are out of the linear correlation, represent the parameters obtained for the absorption spectrum of NATA in DMSO.