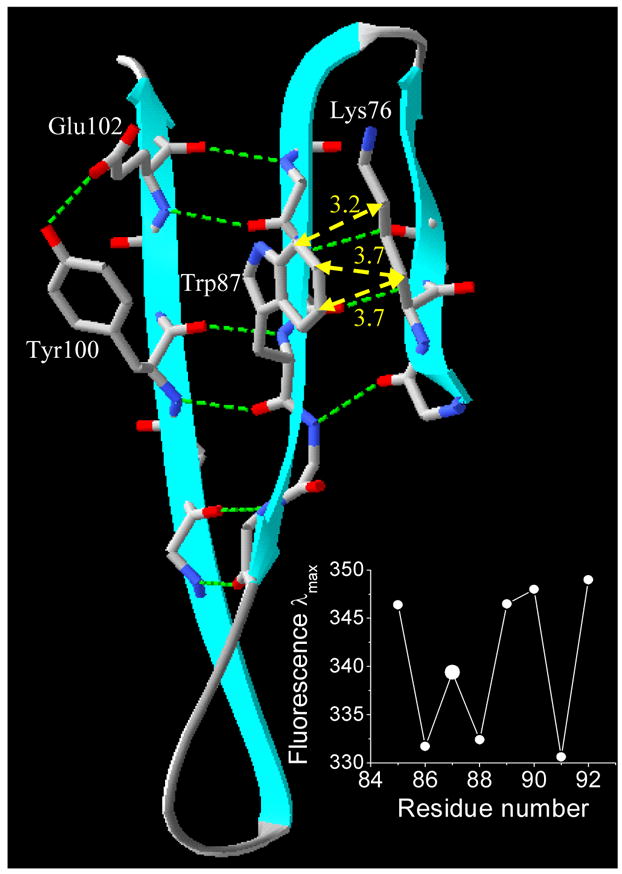
Figure 9.

Ribbon model of TL generated from PDB: 1XKI [8] using SwissPdb Viewer [41]. The position of the side chain of the residue Trp87 (F-strand) relative to that of the residues from flanking strands (Lys76 (E-strand), Tyr100 (G-strand) and Glu102 (G-strand)). The side chains are shown by “stick” representation. Gray, blue and red sticks represent carbon, nitrogen and oxygen atoms, respectively. Dotted green lines show H-bonds. Dotted yellow lines and yellow numbers represent distances (in Å) between the atoms of Trp87 (rotamer g−(−60°; +90°)) and Lys76. The inset figure shows the fluorescence λmax values for the single tryptophan mutants in the F-strand [7].
