
Figure 4.
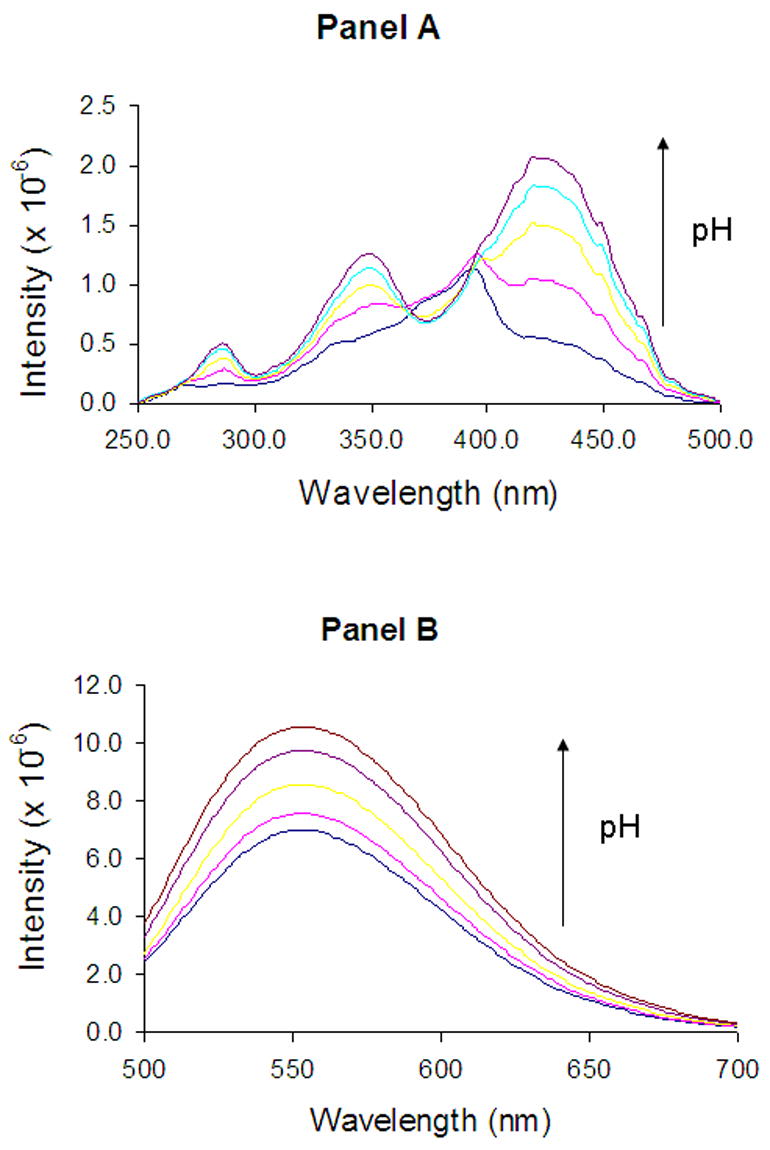
Fluorescence excitation (panel A) and emission (panel B) spectra of DB-67 aqueous buffers of varying pH (7.7–10.1). The arrows show the direction of increasing pH. pH values of the solutions for which the spectra are displayed are 8, 8.5, 9, 9.6 and 10.1, respectively.