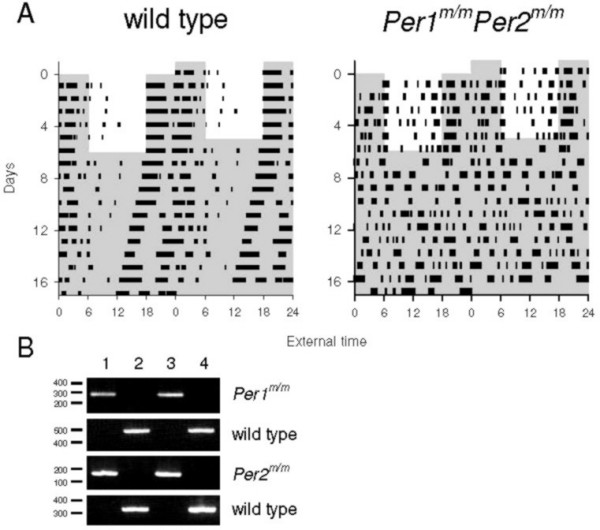
Figure 1.

Activity patterns and genotypes. A) Double plotted actogram of a wildtype mouse (left panel) and a Per1m/mPer2m/m double-mutant mouse (right panel) during a period of light-dark 12:12 followed by a free running rhythms in continuous dim red light. B) Genotyping example of four animals used in this study. Using the same primer sets, lane 1 and 3 show the lighter PCR products for the Per1 and the Per2 fragments indicating the Per1m/mPer2m/m double-mutant genotype in both mice, lane 2 and 4 show the heavier PCR products for both genes indicating the Per1+/+Per2+/+ genotype in both mice. Molecular weight scales are in kiloDalton.
