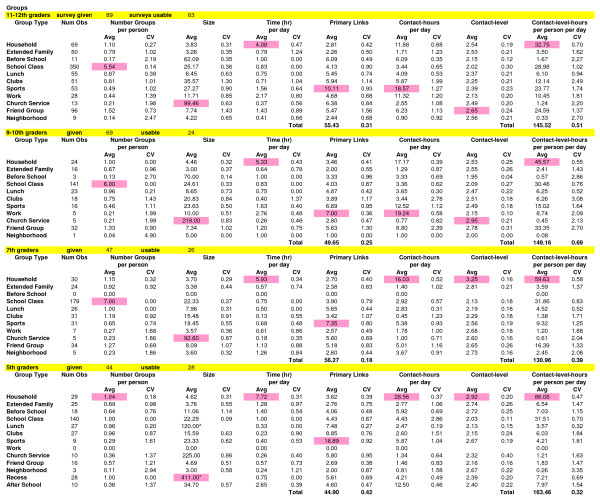
Figure 1.
Summary Statistics for Groups. The highest average value (Avg) for each grade and group is shaded in pink. CV is the coefficient of variation. The number of observations (Obs) for groups is the total number of each kind of group across all people for each grade. Per-person values were calculated for the average student. Per-day values were formed for an average day that incorporated both week days and weekends. All terms are defined in Table 1. * denotes number of students in the school; ^ denotes one third of the school.

