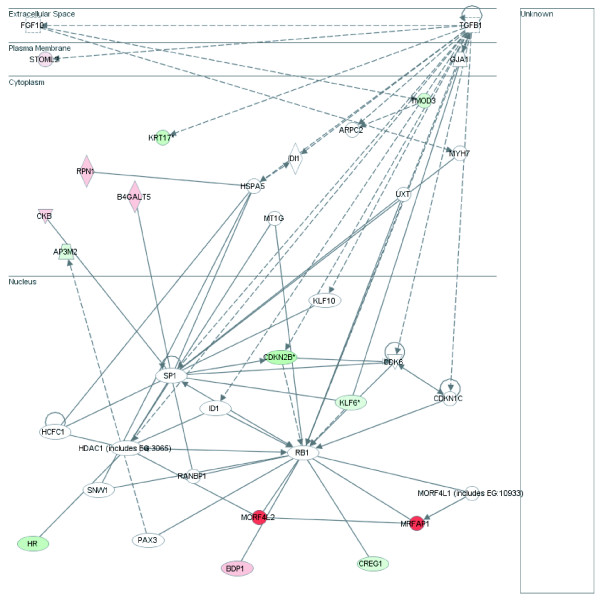
Figure 5.
Gene Network B. Green denotes loss in expression in CIN III while red indicates gain. Intensity of colour signifies magnitude of change. Solid lines indicated direct interactions while dashed lines indicate indirect interactions as described by Ingenuity Pathway Systems. Functions influenced by Network B include cell cycle, gene expression and cancer specific function.

