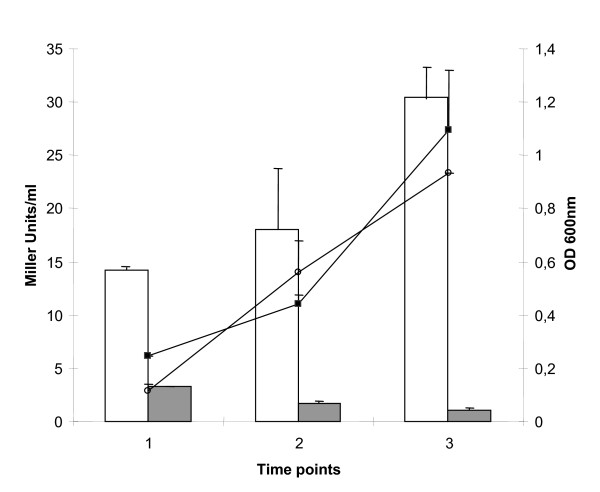
Figure 5.
Effect of Mce3R on its own transcription during in vitro growth of M.tuberculosis. Comparison of mce3R promoter activity during the growth of Δmce3R (pPR3-lacZ) (white bars) and H37Rv (pPR3-lacZ- Mce3R endogenous) (grey bars) strains in M7H9-AD-G medium. The results are presented as β-galactosidase activity expressed as Miller units ± S.D. of duplicate in three time points (1 early exponential phase, 2 exponential phase and 3 stationary phase). Growth curves of Δmce3R (pPR3-lacZ) (circle) and H37Rv (pPR3-lacZ- Mce3R endogenous) (rhombus) strains are shown and the OD 600nm values are indicated on the right. Results represent one of three independent experiments.

