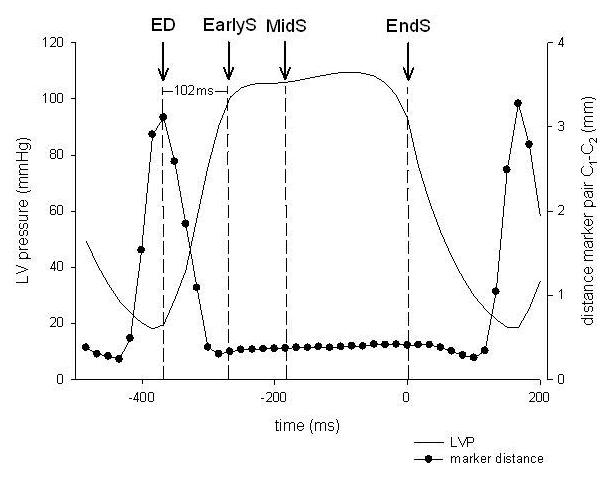
Fig 2.

Schematic to illustrate the determination of time points used. The black line shows LVP and the closed circles represent the plotted distances between the mid-edge marker pair C1-C2 from one representative study under baseline conditions. Greatest separation occurred during early filling and minimal separation occurred during systole during baseline conditions. Mitral orifice area was quantified during the early, mid-, and end-systolic phases. EndS was defined as the frame immediately preceding the peak negative rate of LV pressure change (-dP/dtmax), EarlyS was defined as within 102ms (six frames) after end diastole (representing the early phase of ejection) and MidS as the time-point between end diastole (ED) and EndS. ED was defined as the frame nearest the R-wave on the ECG.
