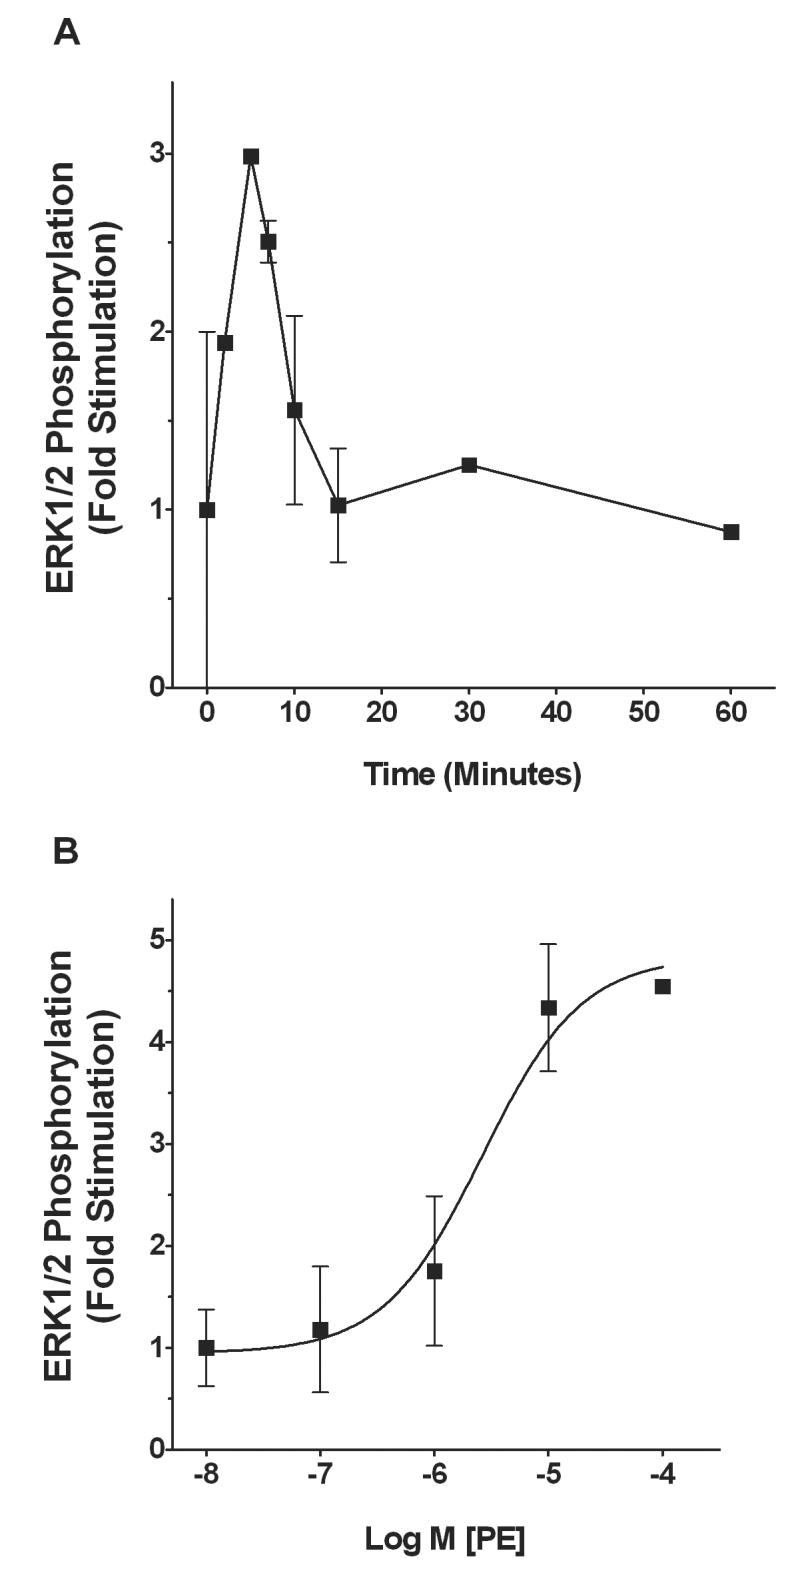
Figure 1.

Time course and concentration-response curve for phenylephrine (PE) stimulation of ERK1/2 phosphorylation in SMG-C10 cells. (A) Cells were stimulated with 10 μM PE and ERK1/2 phosphorylation measured by Western blotting at time points ranging from 10s - 60 min. The data are fold stimulation over basal ERK1/2 activation in the absence of PE and are normalized to maximal ERK1/2 stimulation. (B) Mean concentration-response curve for PE stimulation of ERK1/2 using a 7 min exposure time. Each point on the concentration-response curve is the fold stimulation over basal ERK1/2 activation in the absence of PE normalized to maximal ERK1/2 stimulation. All data are the means ± S.E.M. of 3-4 individual experiments, each using different cell cultures.
