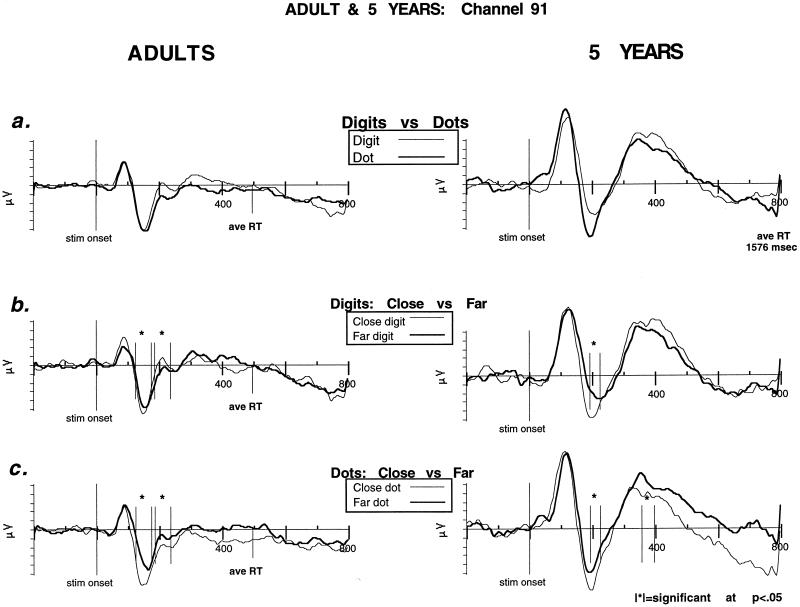
Figure 3.
Representative posterior channel (91) comparing ERPs in adults and 5-year-olds for a number comparison task. The x-axis is in milliseconds and corresponds to a 1-s epic of recorded EEG (200 ms baseline, 800 ms poststimulus). The y-axis is in microvolts. |∗|, significance at P < 0.5. (a) Notation effects (digits vs. dots). The two age groups show qualitatively similar initial components (P1, N1, and P2p) with only slightly delayed peaks in the 5-year-olds. (b) Digits (close vs. far). ERP distance effect for digits in both age groups. (c) Dots (close vs. far). ERP distance effect for dots in both age groups. Significant differences associated with distance began in children 50 ms after adults despite RTs > 1,000 ms longer.

