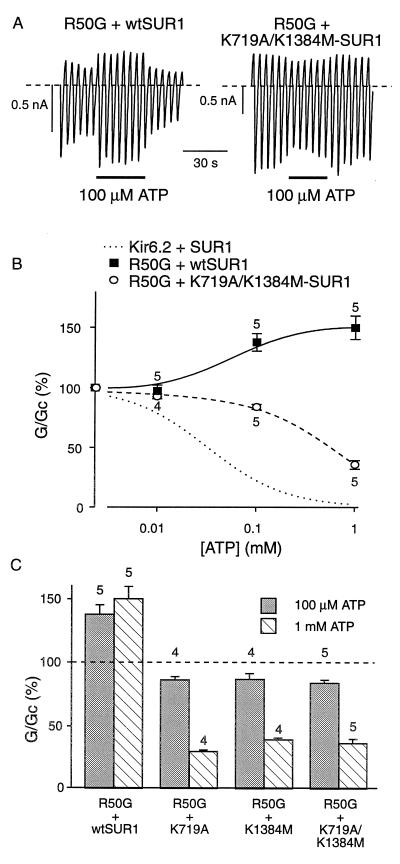
Figure 4.
(A) Macroscopic currents recorded from inside-out patches excised from oocytes coinjected with Kir6.2-R50G and either SUR1 or K719A/K1384M-SUR1 mRNAs. Currents were elicited by a series of voltage ramps from −110 mV to +100 mV. ATP (100 μM) was added to the internal solution as indicated. Mg2+ (1.4 mM) was present throughout so ATP will exist as the Mg2+ salt. (B) Mean ATP dose-response relationships for Kir6.2-R50G/SUR1 or Kir6.2-R50G/SUR1-K719A/K1384M currents, measured in the presence of Mg2+. The slope conductance (G) is expressed as a percentage of the mean (Gc) of that obtained in control (ATP-free) solution. The lines are drawn through the points by eye, and the number of patches is indicated next to each data point. The dotted line indicates the effect of ATP on Kir6.2/SUR1 currents and is the same data as in Fig. 1B. (C) Mean macroscopic slope conductance recorded in the presence of 100 μM or 1 mM MgATP, expressed as a percentage of the slope conductance in the absence of ATP, for channels comprising Kir6.2-R50G and SUR1 containing the mutations indicated. The dashed line indicates the conductance level in control solution. The number of oocytes is given above the bars.

