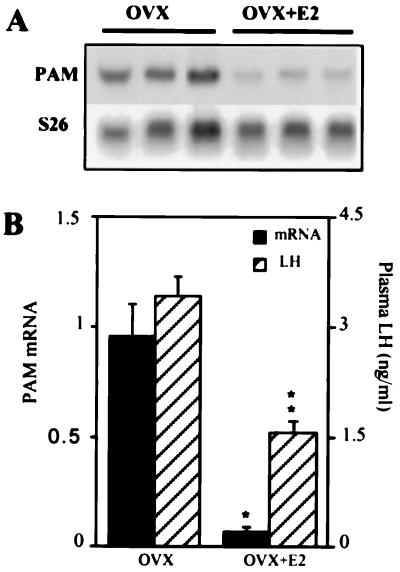
Figure 2.
Effect of estrogen status on uterus PAM mRNA expression. (A) Total RNA (10 μg) from individual animals in each treatment group was subjected to Northern analysis. The blot was hybridized first with the PAM cDNA probe and then stripped and hybridized with the ribosomal protein S26 mRNA probe. (B) Quantitative analysis of the blots shown in A was performed as described for Fig. 1B (▪). Each bar represents the mean ± SEM of three independent experiments. Plasma LH levels (▨) in individual (n = 9) animals were measured as described in the text. The asterisks indicate a significant difference from OVX value (∗, P < 0.0002; ∗∗, P < 0.0001).

