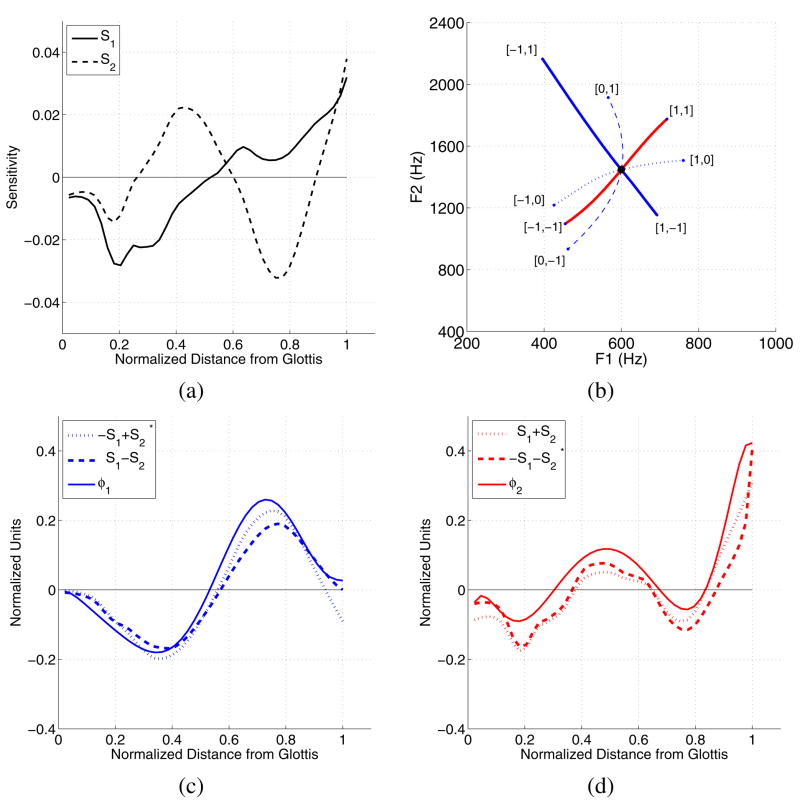
Figure 2.
(Color online) (a) Sensitivity functions calculated for the first two resonances of MAF (dark line in Fig. 1c), (b) [F1,F2] trajectories produced by Eqn. 4 with eight different settings of the z1 and z2 coefficients, (c) comparison of φ1 (solid) to the mean (−S1 + S2) (dotted) and mean (S1 −S2) (dashed), and (d) comparison of φ2 (solid) to the mean (S1 + S2) (dotted) and mean (−S1 − S2) (dashed). In (c) and (d), the sensitivity function combinations have been linearly scaled so that they have roughly the same amplitude as the modes and those with an * have been flipped in polarity purely for visual comparison purposes.

