
Fig. 2.
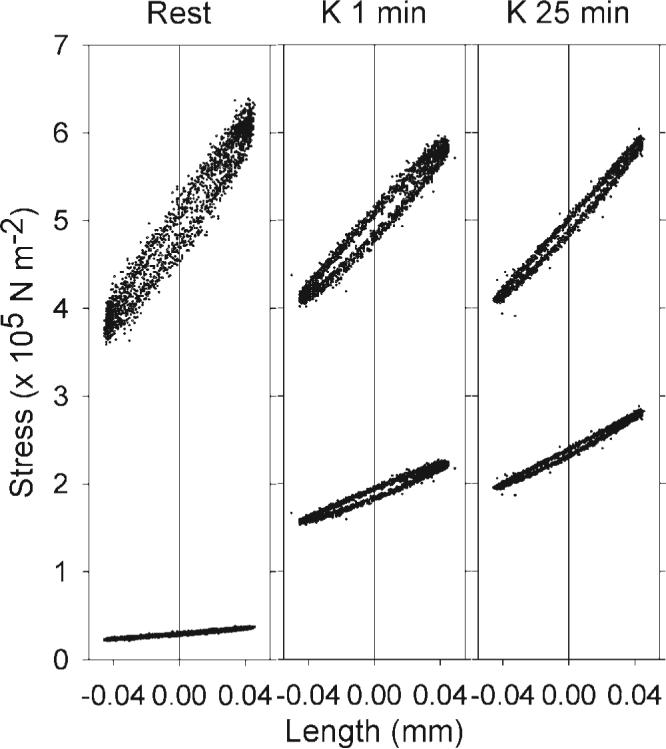
Measurement of hysteresivity. Sinusoidal 0.5% length changes of a representative swine carotid artery were performed at 1 Hz during various phases of a 109 mM K+ depolarization (left, unstimulated; middle, 1-min depolarization; right, 25-min depolarization: two full cycles of each are plotted). The bottom tracings are the measured change in stress as a function of the length change and the upper tracings are the normalized change in stress (so that mean stress was set to 5). The difference between the force tracings measured at zero length (vertical line) is the hysteresivity. Hysteresivity was higher in unstimulated tissues and in tissues stimulated for 1 min compared with tissues stimulated for 25 min.