
Figure 1. DNase hypersensitive regions can be identified flanking adipocyte-selective genes.
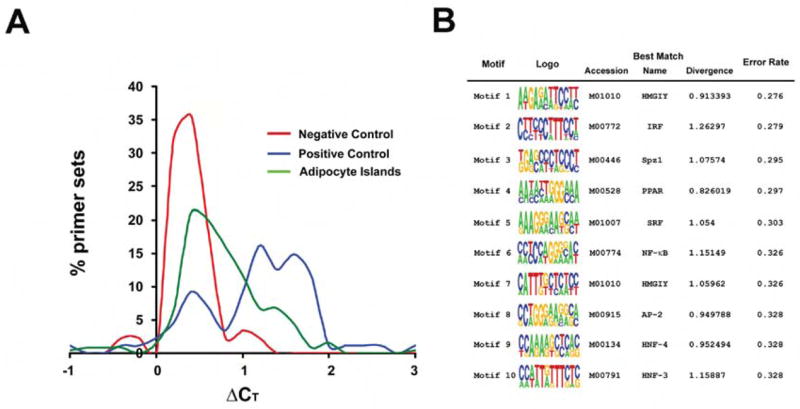
A, DNase hypersensitivity results for Day 7 adipocytes. The X axis represents the difference in cycle threshold (ΔCT) between DNase digested and undigested samples. The Y axis represents the percent of all primer sets that displayed any given ΔCT. The red line corresponds to random primers (negative control). The blue line corresponds to primers that amplify known DHS in other cell types (positive control). The green line describes results using primer pairs derived from the adipocyte selective gene set. See text for details. B, Top motifs identified by DME in differentiation-dependent DHS ranked by Error Rate. The information displayed includes the sequence logo, the Error Rate, and the best matching TRANSFAC profile including the accession identifier, the name of the TRANSFAC profile, and the KL divergence score of the discovered motif and the TRANSFAC motif.