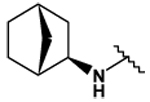
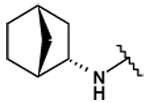
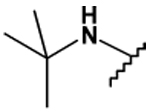
Table 2.
Biological activities obtained for compounds 22, 25–34. The compounds were assayed as described under Table 1. Compounds 25–27, 29 and 34 have a relatively low water solubility due to their high lipophilicity. This is reflected in this assay by a similar or reduced activity at 25 µM versus 2.5 µM. Concentration-dependent increase in activity however was observed in full concentration response curves, with maximal effects at 10 µM.
| Cpd | R | 2.5 µM of Cpd, 1 µM of GABA | 25 µM of Cpd, 1 µM of GABA | 1 µM of GABA | |
|---|---|---|---|---|---|
| Effect (%) ± sem | Effect (%) ± sem | pEC50 ± sem | Emax (%) ± sem | ||
| 22 |  |
80 ±1 | 93 ± 5 | 6.06 ± 0.05 | 83 ± 4 |
| 25 |  |
90 ± 1 | 80 ± 2 | 5.56 ± 0.13 | 132 ± 14 |
| 26 |  |
125 ± 4 | 141 ± 6 | 5.46 ± 0.10 | 185 ± 15 |
| 27 |  |
122 ± 3 | 110 ± 0 | 5.78 ± .03 | 183 ± 4 |
| 28 |  |
82 ± 5 | 52 ± 4 | - | - |
| 29 |  |
128 ± 4 | 70 ± 4 | 5.78 ± 0.03 | 137 ± 3 |
| 30 |  |
28 ± 1 | 32 ± 2 | - | - |
| 31 |  |
36 ± 2 | 69 ± 6 | - | - |
| 32 |  |
29 ± 1 | 39 ± 2 | - | - |
| 33 |  |
40 ± 3 | 21 ± 7 | - | - |
| 34 |  |
58 ± 11 | 59 ± 4 | - | - |
