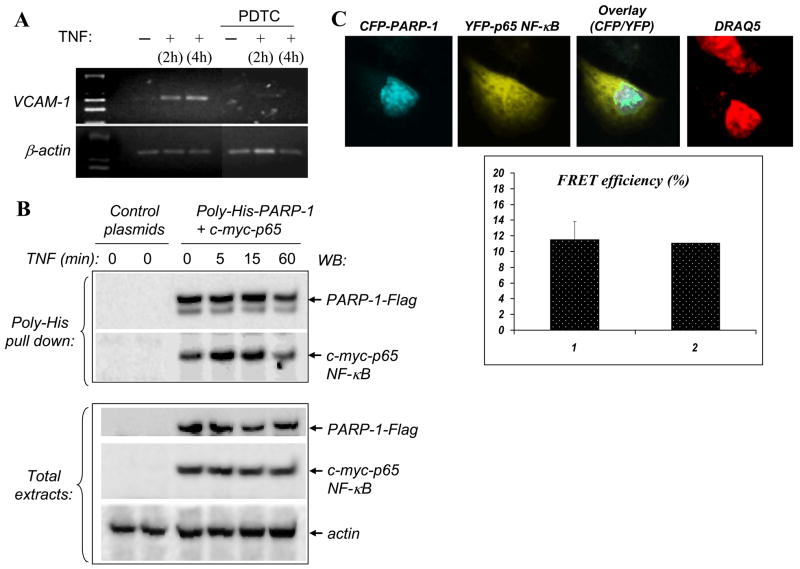
Fig. 3.
Dependence of VCAM-1 expression on NF-κB in PARP-1−/− SMCs and interaction between PARP-1 and p65 NF-κB upon TNF exposure. (A) PARP-1−/− SMCs were stimulated with TNF in the presence of 100 μM PDTC after which expression of VCAM-1 was assessed by RT-PCR; β-actin was used as an internal control. (B) COS-7 cells were co-transfected with expression vectors encoding PARP-1 tagged with poly-His and Flag and p65 NF-κB tagged with c-Myc or with empty vectors. Cells were treated with TNF for the indicated time intervals after which total protein extracts were prepared and subjected to a nickel bead-based pull-down assay. Precipitates were then subjected to immunoblot analysis (WB) with antibodies to either Flag or c-Myc. A portion of the total proteins was subjected to immunoblot analysis to confirm equal expression of PARP-1 and p65 NF-κB in the different conditions; antibodies to actin were used to confirm equal loading. (C) A549 cells were transiently co-transfected with plasmids encoding CFP-PARP-1 and YFP-p65 NF-κB. Cells were then treated with TNF for 15 min. Protein-protein interactions were assessed by FRET analysis using a Leica confocal microscope. The panels represent CFP, YFP, an overlay of both, or DRAQ5 (nuclear marker), respectively; the graph shows an average of FRET efficiency [1] detected in 15 cells in addition to the efficiency of the particular cell shown in the images [2].

