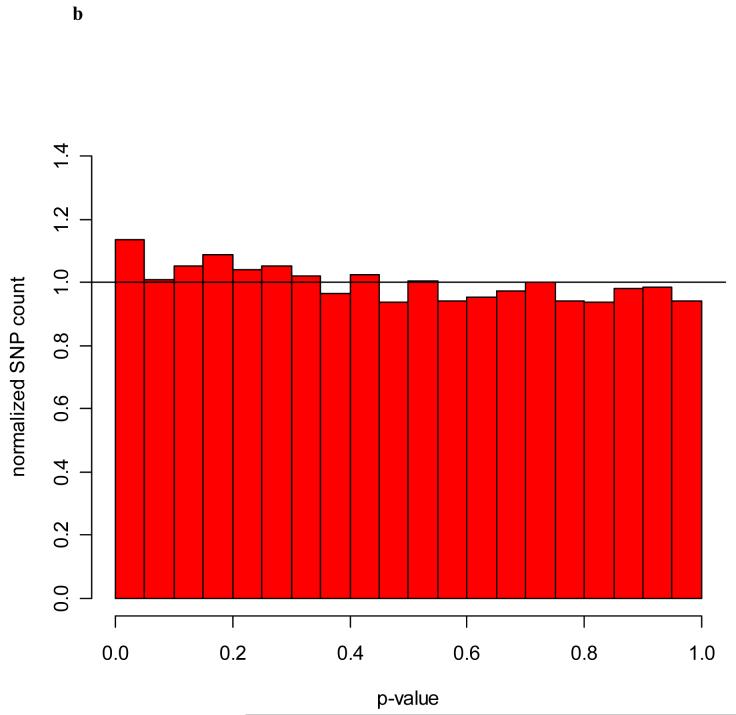
Figure 2.
a) Distribution of p-values from the Stage I sample of the 31,960 individually genotyped SNPs that were selected from pooled genotyping stage. The distribution shows that the pooled genotyping produced an enrichment of SNPs with small p-values. A uniform distribution from 0-1 would be expected if there were no correlation between pooled genotyping and individual genotyping.
b) Distribution of p-values from the additional samples added in Stage II. The distribution is fairly uniform with only a slight enrichment of small p-values.


