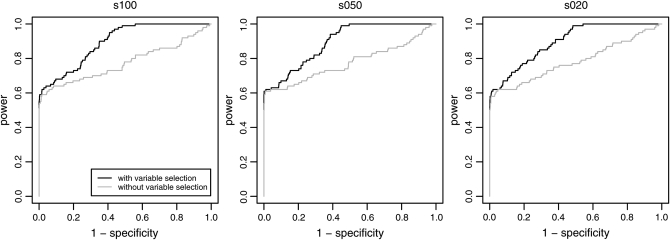
Figure 1.—
ROC curves of three simulated data sets analyzed with the reparameterized method without Bayesian variable selection and with Bayesian variable selection. The power, also known as the true positive rate, is plotted against the false positive rate. Similar ROC curves are obtained for the other simulated data sets.

