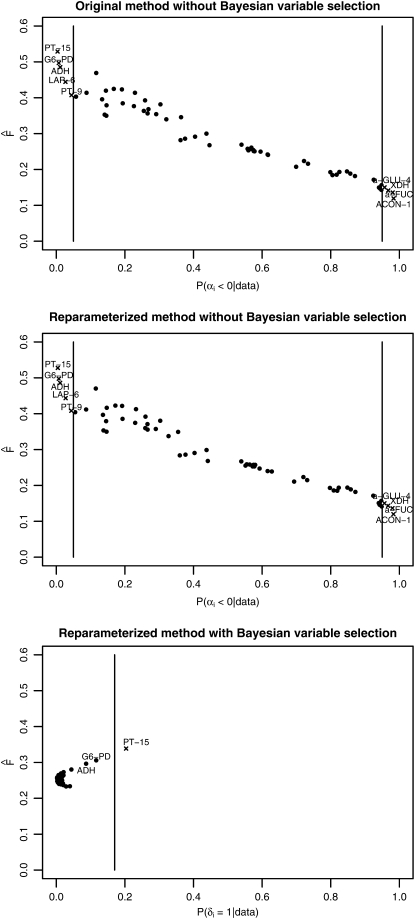
Figure 2.—
Results from the analysis of the Singh and Rhomberg (1987) Drosophila melanogaster data set. Estimated Fst-values are plotted against empirical Bayesian P-values P(αi < 0 | data) for each locus in the case of the original and the reparameterized method without Bayesian variable selection. For the method including Bayesian variable selection the estimated Fst-values are plotted against the posterior probability P(δi = 1 | data). The vertical bars indicate the corresponding critical values used for identifying loci that might be subject to selection. Detected loci are marked with an “x.”

