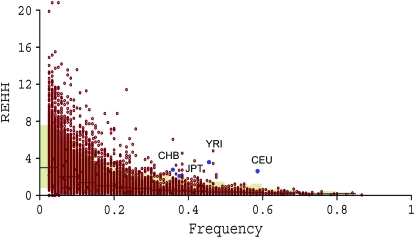
Figure 1.—
The relative extended haplotype homozygosity (REHH) of ASAH1 genes. The REHH values (y-axis) are plotted against the core haplotype frequency (x-axis). Observed REHHs were compared with simulated data with 1000 replications. Brown dots represent simulation results, and blue dots represent the observations of each of the four populations.

