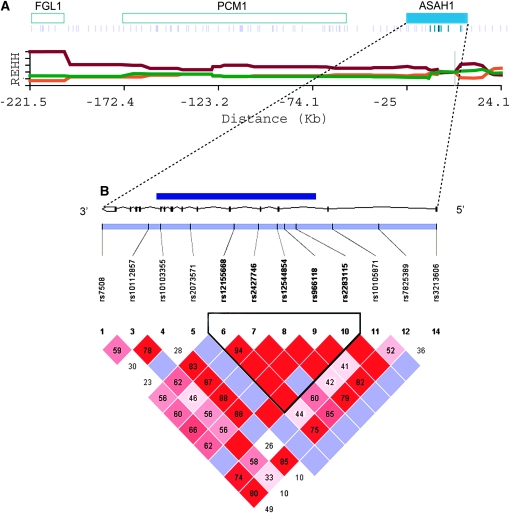
Figure 2.—
A map of genes and SNPs, REHH by distance, and a LD plot of ASAH1. (A) Blue rectangles indicate genes in the ∼200-kb region, with the official symbol of the gene shown on the rectangles. Under the genes, blue bars indicate the SNPs used for the LRH test and dark blue bars represent SNPs in the core region. The x-axis indicates the distance from the core region and the y-axis, the REHH values of each haplotype in the region. Core haplotype sequences are shown in supplemental Figure 3A at http://www.genetics.org/supplemental/. The data presented is based on the CEU panel from the HapMap. (B) A LD plot was drawn using the software Haploview 3.32 (Barrett et al. 2005) and analyzed on the basis of HapMap genotype data in which SNPs were shared in all four populations. The black line expresses the gene structure of ASAH1, and on the line, the dark blue rectangle represents the region sequenced in this study. The black bar in the light blue rectangle shows the location of the SNPs used for the LD analysis, with the reference SNP identification number indicated under each SNP. The triangle represents the LD plot calculated from these SNPs. Numbers in squares represent D′ values (×100, Lewontin 1964) and the color of each square expresses the extent of LD: bright red, LOD (Morton 1955) ≥ 2 and D′ = 1; red and shades of pink, LOD ≥ 2 and D′ < 1; blue, LOD < 2 and D′ = 1; and white, LOD < 2 and D′ < 1. The triangle surrounded by a thick black line shows the LD block according to the definition of Gabriel et al. (2002).

