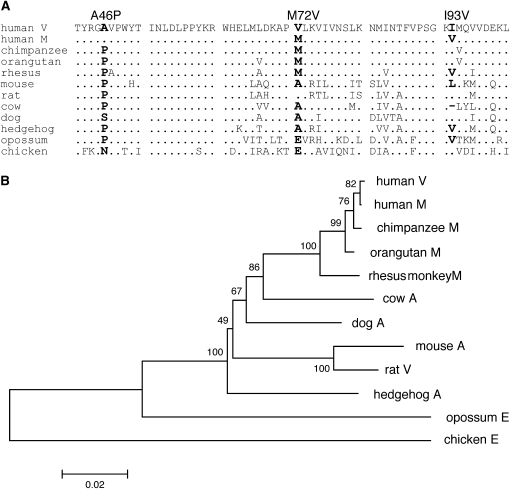
Figure 6.—
Alignment of ASAH1 orthologs from birds and mammals in the SL subregion (A) and the NJ tree obtained on the basis of nonsynonymous substitutions in the entire ASAH1 of these orthologs (B). (A) Dots indicate amino acids that are identical to those in the top line sequence. Dashes represent a deletion. Boldface type indicates amino acid substitutions in the human lineage compared with chimpanzees and birds and other mammals. (B) Numbers near the node indicate the bootstrap probability in 500 replications. The scale bar below the tree represents the number of nonsynonymous substitutions per site. The nonsynonymous sites of 751 bp were compared. The chicken sequence was used as an outgroup. Uppercase letters next to the species name indicate the amino acid at position 72.

