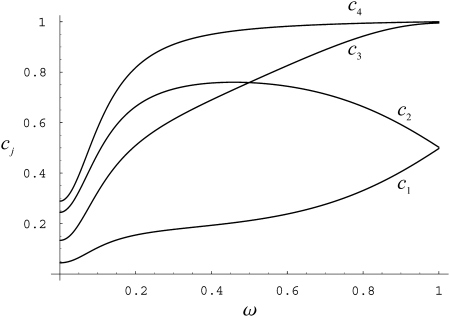
Figure 5.—
Correlations in coalescence times σi, relative to 1 + σ0, as functions of ω when η = 1, φ = 100, and β = α = 1 (see appendix). Line c1, σ0/(1 + σ0); line c2, σ2/(1 + σ0); line c3, 2σ1/(1 + σ0); line c4, (σ2 + σ0)/(1 + σ0). For explanation of symbols see text.

