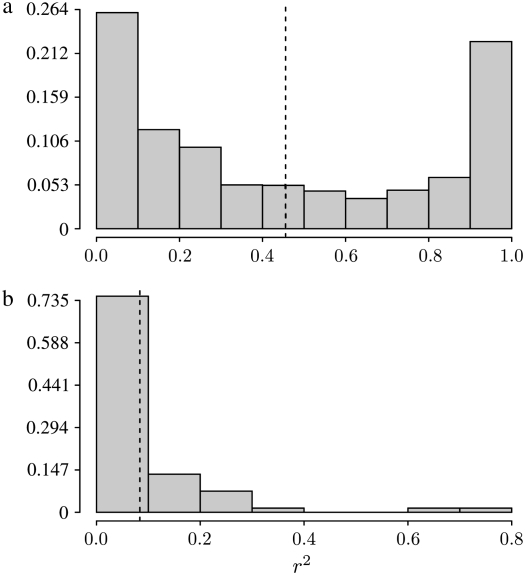
Figure 7.—
The sampling distribution of r2 for sample size 25 after 5 × 10⁴ runs under (a) a “multiple-merger” coalescent process (0 < α < 1) and no recombination (η = 0) and (b) a mixture-distribution coalescent process (α = 1) with η = 1. In a, θ = 0.001 and low-frequency variants (<10%) are excluded, while in b θ = 0.01 and all variants are included. In both cases ω = 0.1 and φ = 1. The vertical dashed lines represent the mean  of each sampling distribution: (a)
  with standard deviation 0.377; (b)
  with standard deviation 0.132.

