Figure 3.—
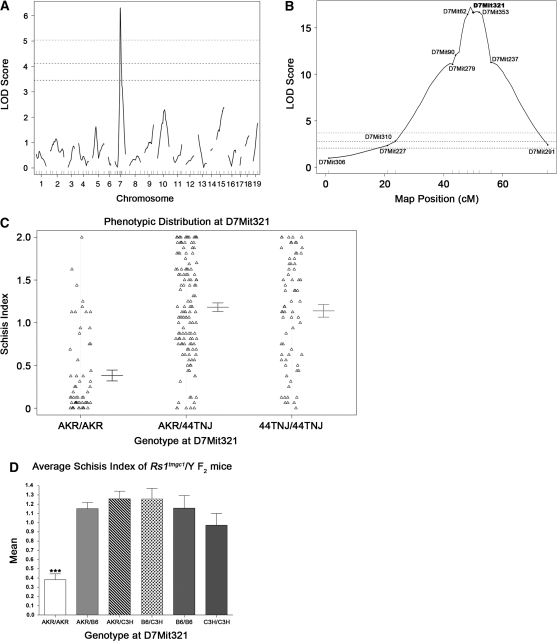
QTL mapping of the modifier of Rs1. (A) Whole genome scan LOD score distribution for association of the schisis index in 45 Rs1tmgc1/Y F2 intercross mice. The QTL on Chr 7 was named Mor1 for modifier of Rs1 1. Three horizontal lines represent significant linkage as assessed by permutation testing (bottom, P < 0.05; middle, P < 0.01; top, P < 0.001). (B) LOD score distribution on Chr 7 for all Rs1tmgc1/Y F2 mice. After Mor1 was identified in the whole genome scan, 225 additional mice were genotyped and phenotyped for Chr 7. The LOD score distribution for the total 270 Rs1tmgc1/Y F2 intercross mice is shown. The genetic map was generated in R/qtl on the basis of our cross. D7Mit321 is the marker that is closest to the peak LOD score of 17.2 (P < 0.0001). Three horizontal lines represent significant linkage as noted in A. (C) Phenotypic distribution of F2 mice at D7Mit321. Error bars represent ±1 standard error. 44TNJ includes both B6 and C3H alleles. (D) Mean schisis index of Rs1tmgc1/Y F2 mice with respect to AKR, B6, and C3H alleles. B6 and C3H alleles render the severe phenotype. Only mice that are AKR/AKR at D7Mit321 show significant reduction of the schisis index (ANOVA, P < 0.0001).

