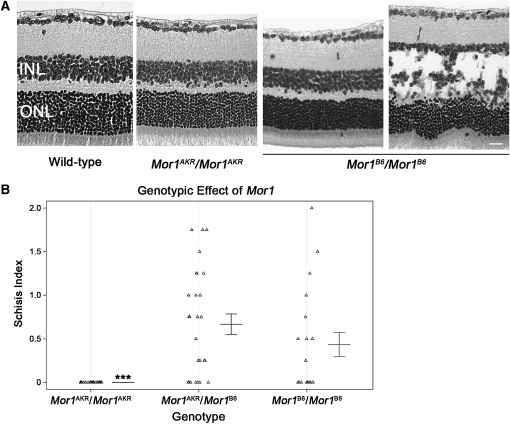
Figure 4.—
Mor1 allelic differences in B6 congenic mice. (A) Images are representative of the phenotypes in the B6 congenic (B6.Cg-Rs1tmgc1) line at P30. All Mor1AKR/Mor1AKR mice do not exhibit the schisis phenotype. Mor1AKR/Mor1B6 (images not shown) and Mor1B6/Mor1B6 mice have a range of phenotypic severity from no schisis to severe schisis. Images of H&E stained paraffin sections are shown. (B) The scatter plot shows the genotypic effect of Mor1 on phenotypic severity in congenic mice. INL, inner nuclear layer; ONL, outer nuclear layer; bar, 20 μm; ***, ANOVA P < 0.0001.

