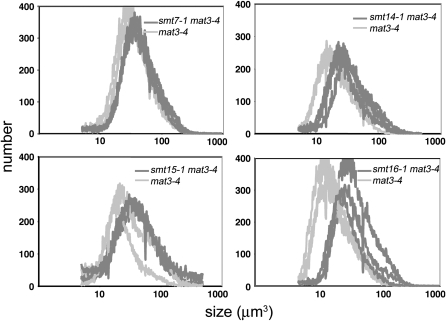
Figure 3.—
Cosegregation of pSI103 insertion and smt phenotype. Cell-size distributions from dark-shifted cultures of mat3-4 (paromomycin-sensitive, emetine-resistant) or smt mat3-4 (paromomycin-resistant, emetine-resistant) progeny from crosses between each smt single mutant and mat3-4 are shown. Three progeny of each genotype are overlaid in each graph. See results for details.

