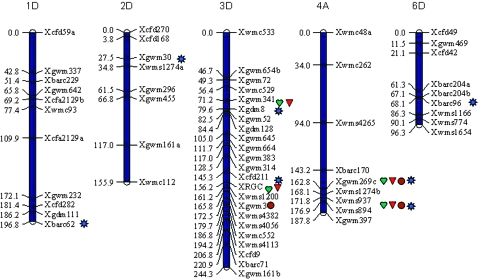
Figure 2.—
Linkage maps and distribution of QTL with main effects and epistatic effects for PHS resistance detected by a mixed-model linear approach in the BC1F7 population derived from Syn37 × Janz. Only the linkage maps on which QTL have been involved are presented. SSR names are listed on the right side of the chromosome with the distance (centimorgans) on the left. Red triangle, QTL for seed dormancy (GI); green heart, QTL for VI; brown circle, QTL for whole spike assay (SI); blue sun, QTL involved only in epistatic interactions.

