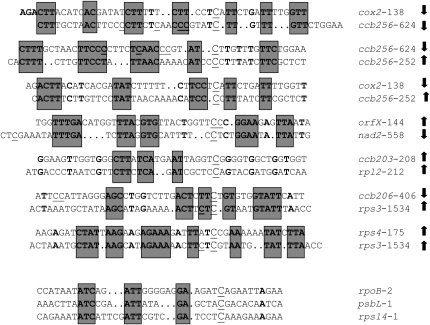
Figure 3.—
Alignment of the sequences around the editable C in sites for which the editing extent shows a strong phenotypic correlation (P < 0.001) and a colocalization of the mapped QTL. Thirty nucleotides upstream and 15 nucleotides downstream of the target C are shown. The target C is capitalized and the edited C's are underlined. Gaps were introduced in the alignments to show similar sequences. Letters in boldface type represent conserved nucleotides, and blocks of conserved nucleotides are shaded. The arrows on the right of the sequences indicate both the allelic effect of the corresponding QTL (upward, Ler increasing and Col decreasing; downward, Col increasing and Ler decreasing) and the sense of the correlation of the corresponding traits (same sense, positive correlation; opposite sense, negative correlation). As a comparison, putative cis-elements found in the upstream sequence of chloroplast sites, rpoB-2, psbL-1, and rps14-1, are shown at the bottom. Overexpression of rpoB-2 in transplastomic plants results in reduction of the editing efficiency of psbL-1 and rps14-1 but does not affect editing efficiency of sites lacking the putative elements (Chateigner-Boutin and Hanson 2002).

