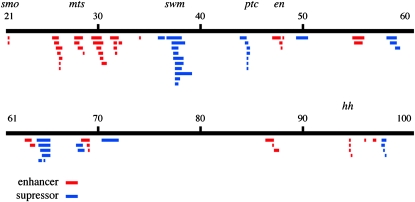
Figure 2.—
Results of the smo RNAi enhancer-suppressor screen. Chromosomes 2 and 3 are depicted graphically as black lines. Below, deletions and mutant chromosomes that enhance (red) or suppress (blue) this phenotype are indicated with bars. Cytological locations are marked, and candidate enhancer and suppressor genes are indicated.

